Features:
- GUIs to examine raw PET data and blood data.
- Alter blood data input without changing original blood file.
- Display image and blood parameters for rapid troubleshooting of data.
- Write quantitated images in ANALYZE data format.
- Create an average image if the raw PET data comes from a dynamic file.
- Examine every aspect of data, or skip intermediate menus to rapidly create quantitative images.
- Write a comprehensive log file for troubleshooting and analysis traceability.
- Currently designed to import GE/Advance PET data files. Modification to other formats possible.
- A comprehensive Instruction Manual. For more information on the theory and assumptions of the FDG 3-compartment model, see the FDG Primer.
All of the following images are displays or menus taken from the FDG program GUI.
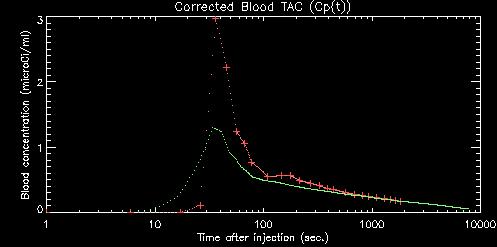
The radioactivity level in the blood must be measured and converted to microCi/ml of plasma. We measure the blood out to 30 minutes post-injection (p.i.), and use a composite blood curve scaled to the final measured time point(s) to estimate the remaining blood levels through the end of the PET scan. We have found a striking similarity, up to a multiplicitive constant, for the shape of the blood curve after 30 minutes across subjects. We take advantage of this by using a scaled composite TAC to provide an estimate of the TAC from 30 minutes through the end of the PET scan. A Time-Activity Curve (TAC) of plasma radioactivity concentration on a 1-second time grid is produced from the blood data.
We implement a 3-compartment model similar to the variation of the Sokoloff method presented in:
Phelps ME, Huang SC, Hoffman EJ, Selin C, Sokoloff L, Kuhl DE, "Tomographic measurement of local cerebral glucose metabolic rate in humans with (F-18)2-fluoro-2-deoxy-D-glucose: Validation of method", Ann Neurol 6:371-388, 1979.
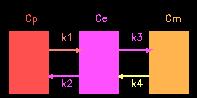
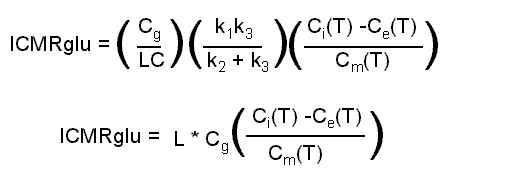
In the illustration above, Cp is the concentration of tracer (FDG) in the plasma, Ce is the concentration of un-metabolized tracer in tissue, and Cm is the concentration of metabolized tracer in tissue. Other parameters required are: the "Lumped Constant" which accounts for (among other things) the differences in metabolic rates of normal glucose and FDG; Cg, the concentration of (non-radioactive) glucose in the plasma; and the rate constants (k1, k2, k3, k4) that dictate the rate of movement of glucose from one compartment to another. The equation we use boils down to:
The program uses the blood TAC and apriori rate constants (k1, k2, k3, k4) to estimate the time-course of unmetabolized (Ce, purple) and metabolized (Cm, yellow) tracer in the tissue, as shown in the plot below.
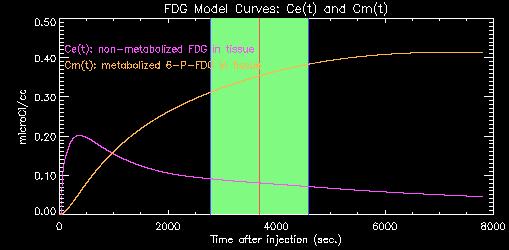
As time progresses, more and more of the original tracer is sequestered in the tissue as metabolized 6-P-FDG. The estimate of the concentrations of metabolized and un-metabolized tracer during the actual PET scan (shown on green above) is used to scale the raw PET data to yield an estimate of lCMRglu for each pixel.
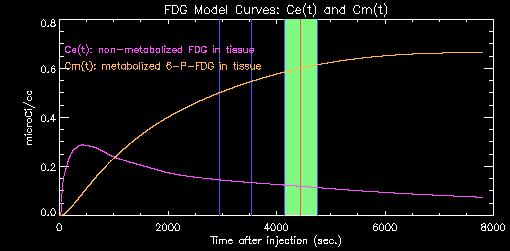
If you have a dynamic or multi-time frame data set, each frame can be displayed independently. In the graph above, a dynamic scan with three (3) frames of 10 minute duration each has been loaded. The third frame is currently active and is displayed in green; the other two frames are denoted by the vertical blue lines. Clicking inside any pair of blue lines updates the image display and statistics to correspond to that frame.
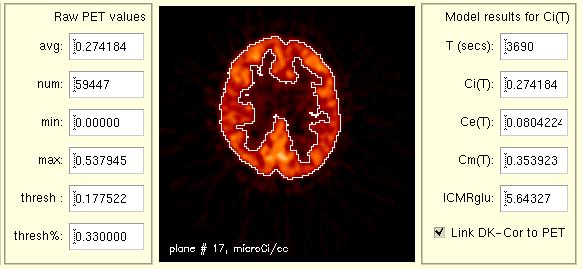
The raw PET data can be interogated to display images as well as various reduced values such as a threshold, average value and number of pixels above the threshold, minimum and maximum values. For a representative PET value (Ci), usually designated as the average value above the threshold in a given frame with mid-time=T, the values for Ce(T), Cm(T), and the corresponding quantitated value (lCMRglu) are shown. A histogram (not shown here) can be used to further investigate the raw PET data and to set the desired threshold level. The threshold is only used to examine your data and the effect of changing e.g. a blood TAC value on the final lCMRglu values. The threshold plays no part in producing the final lCMRglu images.
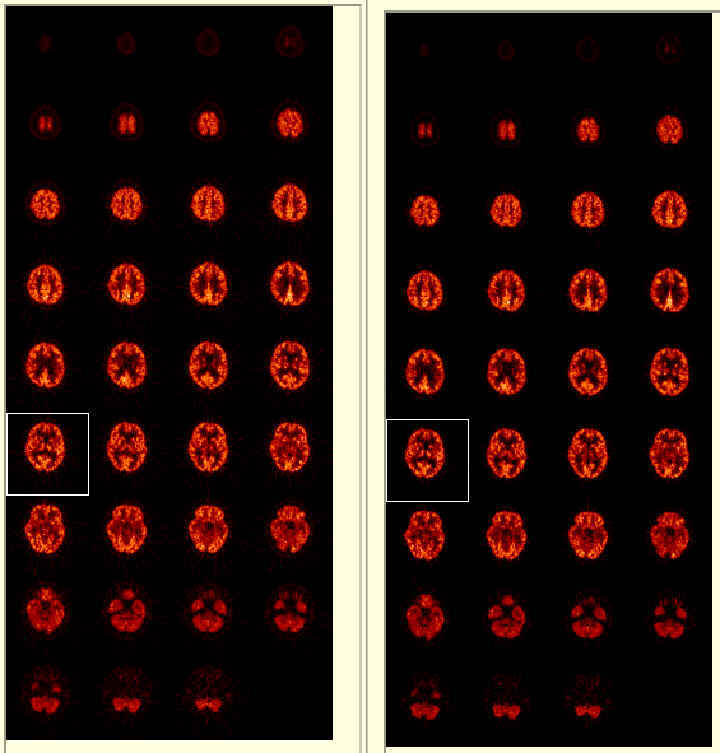
| Original (raw) FDG images. (left) | Quantitated lCMRglu data. (right) |
All of the raw and lCMRglu images can be displayed frame-by-frame. Clicking on one of the images (shown by the white box above) shows large versions of the raw and lCMRglu images side by side for comparison (not shown here) as well as reduced values such as average, etc.