The theory and assumptions behind a quantitative estimate of local Cerebral Metabolic Rate of glucose consumption (lCMRglu).
For a quick overview of how to convert "raw" PET data (in microCi/cc) to quantitative lCMRglu data (mg glucose/min/100 g tissue), see the SPAMALIZE FDG Tool page.
Outline:
Glucose is the primary food source for the brain, providing approximately 90-95% of its energy needs. Glucose is used throughout the body, providing energy for many organs and physiological processes. The level of glucose utilization can be measured with a tracer or analog of glucose.
There are several qualities that are required of a tracer. In general, a good tracer should:
In PET, the most popular glucose tracer is [18F]-2-fluorodeoxyglucose (FDG). The positron-emitting [18F] label permits in vivo detection of the tracer's location and concentration. If more FDG is trapped in a region, it may be assumed that the region has greater metabolic activity. Low uptake compared to a normal person implies hypometabolism, while increased uptake implies hypermetabolism of the traced glucose substrate.
The assumption of a tracer not perturbing a system is usually met by using a very small amount of tracer. The concentration of many interesting biochemicals is typically in the range of 10-3 to 10-6 g/ml. Most PET tracers have a concentration in the body that is 3 or more orders of magnitude smaller than this range. This becomes particularly important for certain neuroligand tracers, where tens of micrograms may have a pharmacological effect. Put another way, the tracer should yield an acceptable signal:noise ratio at concentrations where the toxicity of the tracer is not an issue.
The uptake and subsequent trapping of FDG is a measure of the metabolic rate of glucose phosphorylation. The metabolic pathwayof FDG is fairly simple. It first crosses the blood-brain barrier (for cerebral tracer studies), moving from the plasma into a cell. Once inside a cell, glucose and its radiolabeled analog FDG compete for phosphorylation by hexokinase, which is the first step in glucose metabolism. The result is glucose-6-phosphate or FDG-6-P. In the next step of glucose metabolism it is acted upon by an enzyme, glucose-phosphate-isomerase, to yield Beta-D-fructose-6-phosphate, which is then passed along through a chain of enzymatic reactions to the Krebb's cycle. However, due to the substitution of a fluorine atom, FDG is not a suitable substrate for glucose-phosphate-isomerase! The FDG-6-P cannot travel further down the metabolic pathway, and the reverse reaction of creating FDG from FDG-6-P has a very low reaction rate.
Thus, the tracer remains stuck as FDG-6-P. This is good news, since if there are many further metabolites it is difficult to deteremine the reaction rate of a single metabolic process. Furthermore, the tracer is not only stuck metabolically but also spatially; the efflux of FDG-6-P from the cell is quite slow, so the tracer remains at the location of its initial phosphorylation.
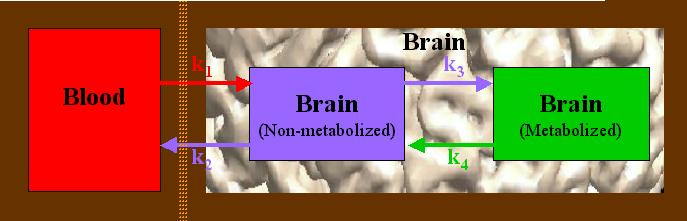
The FDG metabolic process is generally modeled as having three different compartments in which the tracer may reside. This is more formally termed a 3-compartment model, and may be diagrammed as follows:
The orange line represents the blood-brain barrier (BBB). Glucose and FDG move from the blood, across the BBB, and into a brain cell (red arrow), indicated by a rate constant k1. Once there, it undergoes a single metabolic step, k3 (purple arrow to right). The reverse movement or reaction is indicated by, respectively, k2 and k4 (arrows pointing to the left). The rate constants, k1 - k4, represent the rate of "movement" from one compartment into another. In the case of k1 and k2, this is a physical movement across a barrier. In the case of k3 and k4, these actually represent a chemical reaction. The units of the rate constants are given in terms of "amount of substrate per time per amount of tissue", typically as "mg glucose / minute / 100 g tissue".
If you have a dynamic set of 4 or more sequential PET scans, you could attempt to estimate each of the four rate constants on a pixel-by-pixel basis. In particular, you could estimate k3, the critical step of phosphorylation. However, this is usually too noisy to be of much use. Instead, an overall local Cerebral Metabolic Rate of glucose utilization (lCMRglu) is estimated using a priori values for k1-k3 (obtained from lengthy measurments on other subjects), together with a measurement of the concentration in the plasma of the injected tracer (Cp). The equation for lCMRglu is given as follows:
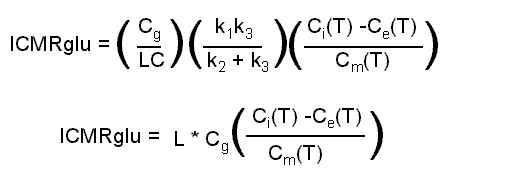
This is the operational equation used to determine lCMRglu. Ci is the concentration of a single PET voxel (mCi/cc). "T" implies a measurement at a particular time, usually 45-60 minutes after injection. Ce is the concentration of non-metabolized tracer in brain tissue, and Cm is the concentration of metabolized tracer in brain tissue. Ce and Cm are both derived from the measured Cp, using the rate constants k1-k4. Other parameters required are the "Lumped Constant" which accounts for (among other things) the differences in metabolic rates of normal glucose and FDG, and Cg, the measured concentration of (non-radioactive) glucose in the plasma. In the above equation, k4 appears in the estimates of Ce and Cm.
We can use typical values for k1-k4 and set up a simple set of differential equations for the compartments Ce and Cm as follows:
Notice that the rate is proportional to the amount of substrate or tracer in the originating compartment. The rate constants determine the relative speed of movement; higher values yield faster movement. Typical rate constant values are usually taken to be as follows (mg/min/100g tissue):
These values are for grey matter (GM). The corresponding rate constants for white matter are 10-25% lower. We use the values for GM since that is the tissue we are typically interested in.
There are usually pixels in the PET data with negative values (if e.g. a filtered backprojection reconstruction is used), even though a negative accumulation of glucose is considered physiologically impossible. Since we are not interested in these "impossible" areas (which are usually in the air surrounding the head), the negative values in the quantitated metabolic data are typically set to 0. The negative values are in the original data to conserve the total counts or activity in the field-of-view, so removing the negative values introduces some bias, but this is usually ignored.
Using the two differential equations, we can model the time-course of the radioactive tracer in the two compartments (Ce(t) and Cm(t)) if we know Cp, the time-course of radioactivity in the plasma. Supposing we start with a bolus injection of 5 mCi of FDG, we will get time-activity curves (TACs) like the following:
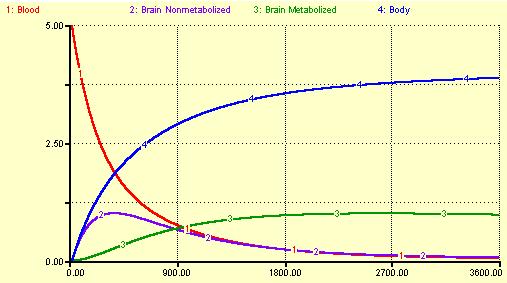
The time scale is in seconds.
Another compartment, the body, is included in this model. If we had an actual measured blood TAC, we would not include this compartment in our model. Here, the rate constant for the body was set at the same value as k1, but the possibility of returning FDG from the body to the blood was excluded. The body continues to accumulate tracer throughout the hour-long duration of this model.
The interesting part is what happens to the blood and brain compartments. The blood continuously loses radioacative tracer, decreasing at an exponential rate. The first brain compartment, Ce (Non-metabolized), rises at first with a peak somewhat delayed from the blood compartment's peak. Ce then loses activity as tracer returns to the blood and also leaks into the Metabolized compartment, Cm. At later times, Ce closely follows the TAC of the blood. The Metabolized compartment has a peak which is delayed much longer than Ce, reaching its maximal value about 45 minutes after injection. If k4 were ignored (or set to 0), Cm would slowly continue to rise. In this model, since k4 is non-zero all of the radioactivity will eventually end up in the body. In an actual FDG scan, most of the radioactive F-18 label is excreted through the kidneys and bladder.
III. Measuring the Plasma Time-Activity Curve
In order to use the rate constants to estimate the lCMRglu, you need to know the opportunity that a given brain cell or voxel had to take up and retain the FDG tracer. If a voxel has a high concentration of activity, this is not very interesting if a large amount of tracer was injected. However, if a voxel has a high concentration when a low amount of activity is injected, this indicates that the voxel managed to sequester a large amount of glucose, probably because it was very metabolically active. In order to compare one scan to another, we need to know the opportunity each voxel had to sequester the tracer.
This opportunity is characterized as the Time-Activity Curve (TAC) of the plasma radioactivity concentration. Small samples of blood (~1 ml) are withdrawn throughout the uptake period (from 0 to 30-60 minutes). The samples are centrifuged to seperate the plasma from the red blood cells, and the plasma is drawn off and counted in a well-counter. The detected counts are then decay-corrected back to the time of injection, as is the PET scan. The measurements are converted to a 1-second grid, interpolating between measured points, to yield the TAC for Cp. Estimates of Ce and Cm are finally derived from Cp using the rate constants k1-k4.
To see the details of how we draw and treat the blood samples at the LfAN, refer to the pdf-format FDG manual.
We implement a 3-compartment model similar to the variation of the Sokoloff method presented in:
Phelps ME, Huang SC, Hoffman EJ, Selin C, Sokoloff L, Kuhl DE, "Tomographic measurement of local cerebral glucose metabolic rate in humans with (F-18)2-fluoro-2-deoxy-D-glucose: Validation of method", Ann Neurol 6:371-388, 1979.
Other helpful sources include:
Sokoloff L, Reivich M, Kennedy C, Des Rosiers MH, Patlak CS, Pettigrew KD, Sakurada O, Shinohara M, "The [14C]deoxyglucose method for the measurement of local cerebral glucose utilization: Theory, procedure, and normal values in the conscious and anesthitized albino rat", J. Neurochemistry, 28:897-916, 1977.
Reivich M, Alavi A, Wolf A, Fowler J, Russel J, Arnett C, MacGregor RR, Shiue CY, Atkins H, Anand A, Dann R, Greenburg JH, "Glucose Metabolic rate kinetic model parameter determination in humans: The lumped constants and rate constants for [18F]fluorodeoxyglucose and [11C]deoxyglucose", J. Cereb. Blood Flow Metab., 5:179-192, 1985.
Chang JYC, Duara R, Barker W, Apicella A, Finn R, "Two behavioral states studied in a single PET/FDG procedure: Theory, method and preliminary results", J. Nucl. Med., 28:852-860, 1987.
Takikawa et al, "Noninvasive quantitative FDG pet studies with an estimated input function derived from a population-based arterial blood curve", Radiology 188(1):131, 1993.
Wang GJ, Volkow ND, Wolf AP, Brodie JD, Hitzemann RJ, "Intersubject variability of brain glucose metabolic measurements in young normal males", J. Nucl. Med., 35:1457-1466, 1994.
Schmidt KC, Lucignani G, Sokoloff L, "Fluorine-18-fluorodeoxyglucose PET to determine regional cerebral glucose utilization: A re-examination", JNM, 37(2):394-399, 1996.