ShowSlices Multivolume Image Display
Introduction:
ShowSlices is designed to display multiple slices from a 3D image volume, and is fast and simple to use. Features:
Examples:
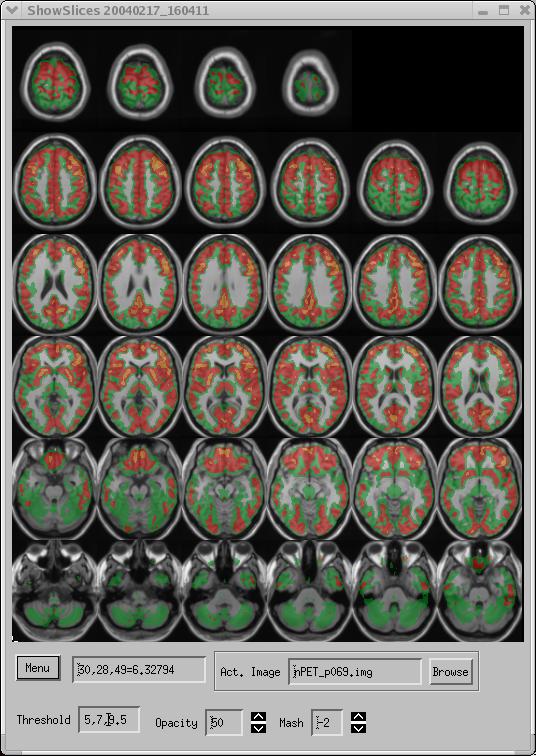
Figure 1. PET data overlaid on an MRI image.
The PET data in Figure 1 range from 0.0-11.5. A threshold of 5.0 has been selected; data below this level are not shown. Additionally, 2 higher thresholds (7, 9.5) were also selected. Values between 5-7 are shown in green, values from 7-9.5 are shown in red, and values higher than 9.5 are shown in yellow. This is a handy way to show isocontours. It is also a convenient way to investigate multiple levels of significance if the overlay image represents a map of t-test values (an SPM). The overlay is partly opaque, permitting a view of the underlying MRI image. Every other MRI slice is shown (Mash = -2). However, the maximum value for the corresponding PET slice, as well as the unshown MRI slice, is displayed. If Mash=N_slices, the display is similar to the familiar glass brain in SPM2. ShowSlices permits a more slicewise approach to the glass brain, permitting better localization of activations.
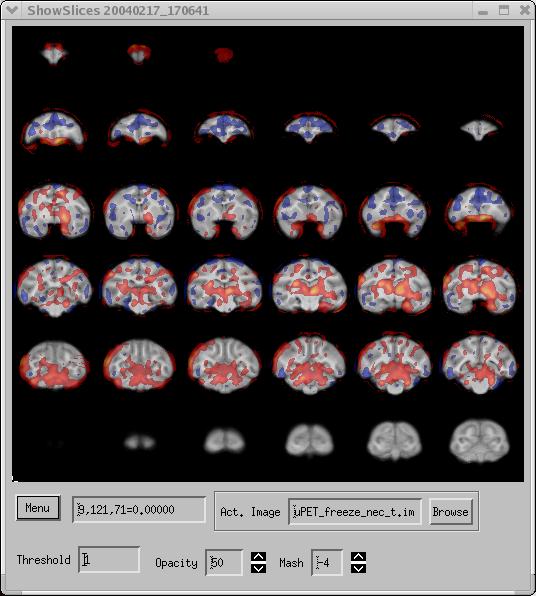
Figure 2. SPM t-test activation data overlaid on MRI image.
The data in Figure 2 were obtained from a study of a large number of subjects. Both SPM2 and fmristat were used to analyze the data. The data shown above were derived from fmristat. The images can be displayed either coronally, sagittally, or axially. The overlay image is a t-statistic pixel-map. A lower threshold of 1.0 was selected, removing overlay pixels below this value. Since this was a two-tailed t-test, there are negative as well as positive values in the data. Selecting a threshold (with "Zero Center" set to "On" ) causes both positive values greater than the threshold as well as negative values less than the opposite of the threshold to be displayed. For example, in Figure 2, the red/yellow regions show positive t-statistic values, while the the blue regions show negative t-statistic values. This lets you investigate both sides of a contrast simultaneously.
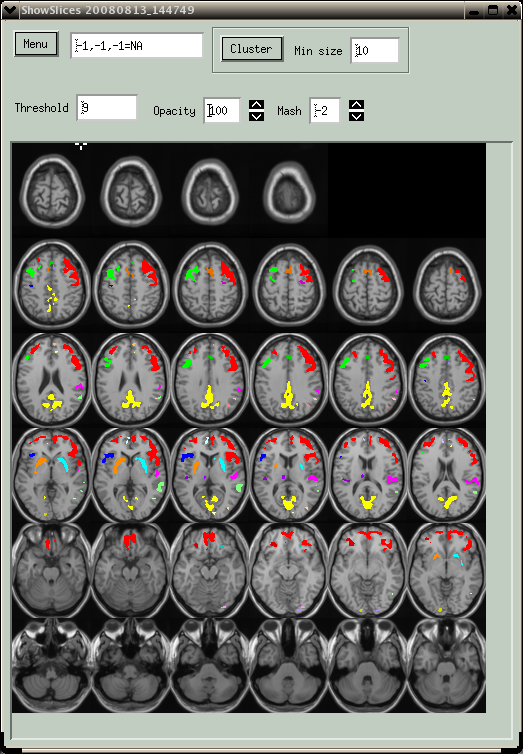
Figure 3.Clusters for PET activation data overlaid on MRI image.
In Fig. 3, PET FDG data were thresholded at a value of 9.0 (relatively high for FDG data), and a minimum cluster size of 10 was specified. The "Cluster->Find All" analysis was run, and each spatially distinct cluster is shown with a different color. There are actually 29 clusters, but most are small and difficult to see. The clusters are ranked according to the maximum value in each cluster. A textual summary of the cluster analysis is printed to the Spamalize text window. The cluster analysis is fast enough (under 1 second) that it is considered interactive. Once you see all of the clusters, you can focus on a single one using the "Cluster->Show Current" button.
User-Changeable Parameters
Loading Image Data:
When ShowSlices is created, it may or may not have an image automatically assigned to it. If not, you will have to browse for a base image and then an optional activation image, in that order. The browsers should pop up automatically. The image data in an existing ShowSlices may be changed by reading in new data. Select "Menu->Read->Activation" or "Menu->Read->Image". The filename of the activation image (if known) will be displayed.
The activation image must be the same size (dimensions) as the base Image. If a new base Image is read which has different sizes than an existing Activation Image, the Activation Image will be removed from the ShowSlices. The data are stored in the precision with which they are read (8-bit, 16-bit integers, floating-point, etc.). However, the displayed values are generally converted to floating-point.
Location and Value:
The current location in the 3D array and the value at that location are displayed in the text-box below the images. The location is in terms of x,y,z coordinates for the 3D image array. Values are 0-based, meaning the first column (or row, or slice) has an index value of zero. The maximum value is thus N-1. You may type a set of coordinates in the text box to jump directly to that location. For example: 30, 40, 50 (then hit "Return").
If the zoom is not exactly 1.0, some interpolation takes place. In ShowSlices, the interpolation is in determining the location, so that for zoom<1.0, some locations will be skipped over. However, for the location that is displayed, the exact data value is shown. If only a Base Image is present, its value is displayed. If an Activation Image is also present, the value for the Activation Image is displayed. See "Mash" below for details on what the value is when multiple planes are mashed together.
Threshold:
You may set a threshold for displaying the Activation Image. Values below the threshold will not be displayed. If the Activation Image contains negative values and you select "Menu->Zero Center->On", the data are treated as if they represent a two-tailed t-test, and both the positive and negative values are shown. Positive values above the threshold are displayed as expected, and negative values less than the negative value of the threshold are also shown. With an appropriate Color Table (e.g. "Blue/Red Lo/Hi2") the negative and positive values can be displayed with different colors.
You may type in multiple thresholds, with each value separated by a comma and/or space. Values between each of the thresholds are shown as a seperate color band. The selected color table strongly influences the quality of the display. You do not need to explicitly enter the maximum value: the highest band will be for values higher than the largest threshold value. This feature can be handy for exploring multiple levels of significance in the same data set.
Opacity:
The opacity of the Activation Image may be varied between 0 (completely transparent) and 100 (completely opaque).
Mash:
Multiple slices may be "mashed" together to provide a compressed view of your data. For values N > 1, every Nth slice is displayed. The displayed location and value refers to this single slice. A perhaps more useful feature is that you can also compress several slices into a single displayed slice, by selecting negative mash values. For example, Mash=-3 compresses data from 3 Activation Images onto a single slice (only a single Base Image slice is displayed). The maximum of the 3 slices is displayed in the image, and the maximum value across the 3 slices at the curent location is shown in the text-box. This can let you compress a large number of slices into a relatively small area while still preserving a reasonable amount of spatial information.
Menu Items:
Many of the parameters are accessed via the drop-down menu. Although this is not as handy as having all of the buttons on the top level of the GUI, it makes for a very compact arrangement. The various menu items are detailed below.
Aspect Ratio:
Can be either "On" of "Off". If it is Off, each image is displayed as a squarish image, and the object may look abnormally squeezed or elongated in one dimension. However, this makes for a compact, reproducible display. If the Aspect Ratio is "On", the proportions of the image should look correct, but, the size of the window will vary depending on the dimensions of the image volume and the voxel size (mm). This can make it difficult to fit into other GUIs nicely. If ShowSlices is a standalone application (without a parent GUI) the Aspect Ratio is usually "On". If it is inside another GUI and the size is important, it is best to leave the Aspect Ratio "Off". If the Aspect Ratio is "On", the Y-dimension is scaled to fit the X-dimension. It will not matter what value you enter for the Y-dimension, as only the value of the X-dimension is considered in determining image display size.
Cluster:
There are two cluster features:
- Find All: identifies independent (spatially unconnected) clusters above thethreshold. You can filter out small, uninteresting clusters by setting a minimum size via the "Min size" text box. Each cluster is shown in a different color. Clusters are ranked according to the maximum value in each cluster, and the value of each cluster is the ranking (i.e. integers, 1-N_clusters).
- Show Current: shows the single cluster surrounding, or nearest to, the current location. The cluster is simply the supra-threshold activation image, with display of other clusters suppressed.
The cluster menu provides a visually more sophisticated version of the "Go To" options (see below).
Color Table:
You may load in seperate color tables for the Base and Activation Images.
Crosshairs:
Can be either on or off. If on, the location of the current position (defined by the last click with the right-hand mouse button) is displayed. If the ShowSlices is part of a larger widget, this is the location that gets passed to the parent.
The Color of the crosshairs may be changed. Select "Menu->Crosshairs->Color" and then click on the "Colors" button in the menu below the images. Select the color you want from the pop-up menu and click "Accept".
Go To:
You may jump to the maximum value in the entire Base or Activation image set, or you can find the maximum value in the cluster at the current location. The Global Max will be found regrdless of where the current location is. To find a Cluster Max, first position the crosshairs in the desired cluster, then select "Menu->Go To:->Cluster Max". Alternately, click on a cluster with the right mouse button to find the Cluster Max in one step.
You can also find the minimum value in a cluster or globally by selecting e.g. "Menu->Go To:->Cluster Min". If "Zero Center" is on, then the value at the current location will be examined; if it is negative, the minimum cluster value will automatically be found, and if it is positive, the maximum cluster value will be found. This works for either right-clicking or selecting "Go To->..." in the menu.
New:
Pops up a new ShowSlices with the same images as in the original. You may then modify the new one as desired.
Order:
Flips the images top-to-bottom, in case they appear upside-down and this annoys you.
Orientation:
You may select any one of Axial, Coronal, or Sagittal orientations. Note the labels may be somewhat arbitrary, as it is assumed that the image data have an initial Axial orientation. In order to make the display robust, a squarish image format was selected, so images can look somewhat distorted if one of the dimensions id much longer than another.
Read:
You may read in a new Base and/or Activation Image. See discussion above in "Loading Image Data".
Refresh:
Select this button to refresh (update) the display.
Resize:
Type in the size of the display window (in pixels) you want. The display will resize itself. You can type in either a single number (interpreted as the dimsnsions of a square display) or two numbers separated by either a comma or a space. The display size is limited to a minimum of 32, and amaximum of 75% of the width (for X) or the height (for Y) of the screen.See discussion above in "Aspect Ratio" for further details.
Write:
You may write the displayed image to a BMP or JPG file. Select the format you want, then click on the "write" button in the GUI. It will be written to the file designated in the text-box next to the "write" button.
Zero Center:
May be "Off" or "On" to control display of Activation Image if there are negative values present. If the Activation Image contains negative values and you select "Menu->Zero Center->On", the data are treated as if they represent a two-tailed t-test, and both the positive and negative values are shown. Positive values above the threshold are displayed as expected, and negative values less than the negative value of the threshold are also shown. You will probably want to load a "split" color table, for instance "Blue/Red Lo/Hi2".
Zoom:
Change the size of the displayed images. Values smaller than 1.0 cause shrinkage. Limited to range of 0.10 to 10.
Help:
If you got this far, you know how to work the help button.
Cancel:
Cancels out of the pulldown menu with no action taken.
Quit:
Quits out of the ShowSlices, destroying the GUI and dumping the data.
Programming Details:
ShowSlices is written as an IDL object for image display. It is part of the Spamalize suite of medicaliamge processing programs. It may be either a freestanding application with its own GUI, or it may be inserted into a parent widget. When it is part of a larger widget, it is designed to communicate back and forth with the parent widget regarding curent location, value, etc. See the comments in the source-code for further enlightenment.
Contact Terry Oakes (troakes - at - wisc.edu) with questions or suggestions.
Last updated: 2008 Aug. 13th.