Histogram Tool
Introduction:
The Histogram Tool is a component of BrainMaker. It shows the histogram of the currently loaded image and other associated images (Over, Alt images). Much more than this, however, the HistoMulti tool is interactive: it lets you define a VOI mask directly from the histogram. Furthermore, if an Alt image is available, a 3-dimensional histogram is created, permitting multispectral segmentation and analysis of the image space. When you select histogram bins, the corresponding pixels in the image are automatically included in a VOI.
Standard (2D) histogram:
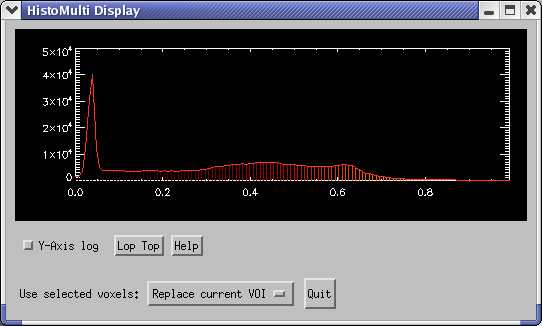
A histogram with 128 bins is created for the primary Image in BrainMaker. Bins in the histogram may be selected, and pixels in the Image with values that fall into the selected bin(s) are selected. The Help button provides simple instructions for selecting a single bin, a group of contiguous bins, or any combination thereof.
Use selected voxels: There are 3 options designating the fate of the selected voxels in the BrainMaker mask:
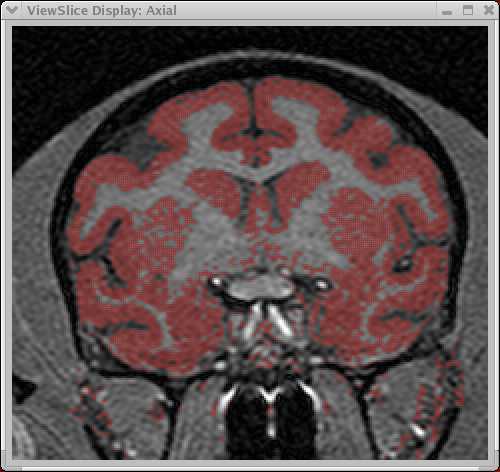
Selecting the grey matter region from a histogram of a T1-weighted MRI image looks like this:
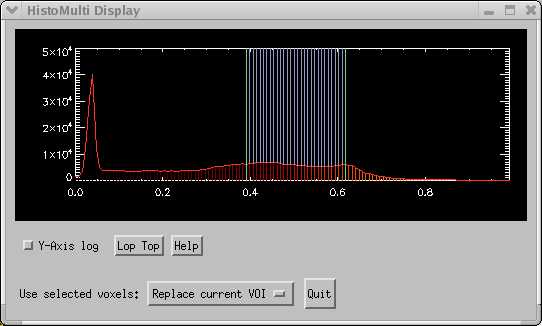
and produces this result in the image:
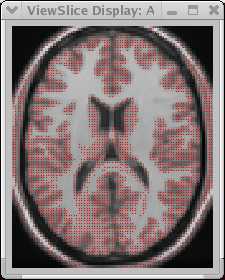
This took about 2 seconds to identify the GM voxels for the entire image volume. It usually takes longer than this to define the GM manually on a single slice! For reasonable MRI images (decent S:N, low bias field distortion) it is at least as accurate as most manual drawers.
Selecting histogram bins:
There are several ways to select histogram bins. Click with the left mouse button to select ur unselect a single bin. Click, hold the mouse down and drag to a new bin, and release the mouse to select a range of bins. Selected bins are colored blue. Borders can be set or removed by clicking with the right mouse button. Click between 2 borders to select or deselect all of the bins between the borders.
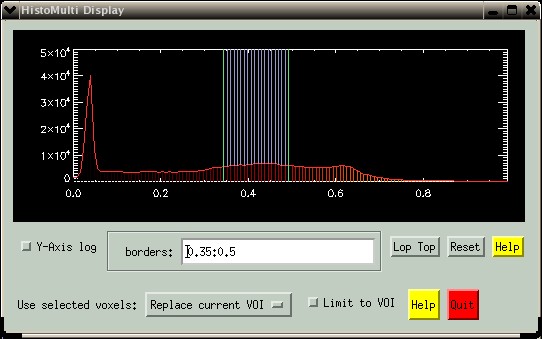
You can also enter a range of values in the "borders" text-box. Enter values from the image (not histogram bins). In the picture below, values were selected ranging from 0.35 to 0.50, corresponding to grey matter in the histogram of the T1-weighted MRI. The syntax is simple: Select one or more single bins separated by spaces or commas. Select a range of values using a colon, e.g. "0.35:0.50". Deselect a range using a hash, e.g. "0.50#0.75". Various combinations can be included in a single command, e.g. "0.1, 0.35:0.5#0.7, 0.8:0.9". In case of competing requests, e.g. "0.35:0.5#0.7". where the bin coresponding to 0.5 is in both the "select" and "deselect" requests, the "select" command will win.
The Help buttons provide instructions for selecting/deselecting histogram bins.
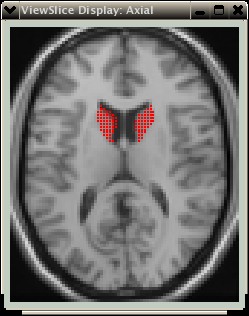
The button "Limit to VOI" lets you create a histogram from only the image pixels currently in the BrainMaker VOI. This can be useful to restrict histogram bins for more precise selection. In the example below. a VOI was drawn over the caudate. Then, the "Limit to VOI" button was selected, creating the new histogram shown on the right. Note the smaller range of values (0.17-0.66) compared to the histogram above (0.0-1.0).
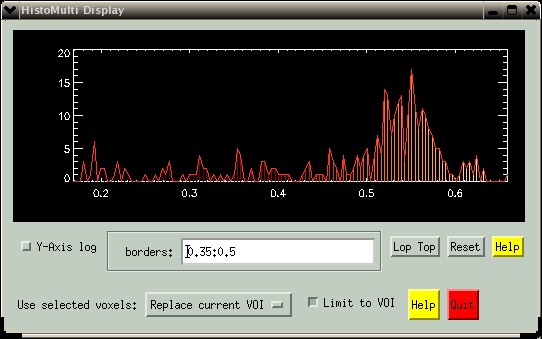
The grey matter has values ~0.35 to 0.6, and it is obvious from the histogram that pixels from the ventricles have been included. The range of GM values can now be selected, just as in the original histogram- see the example below:
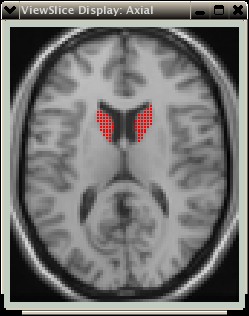
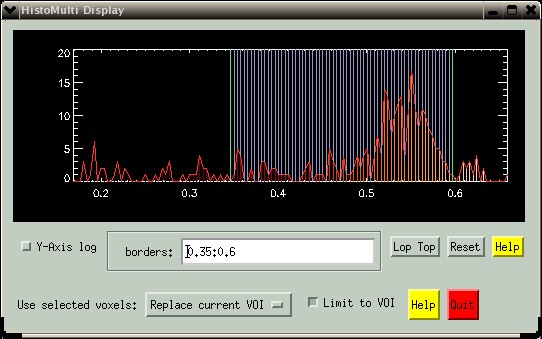
Notice how the VOI no longer "leaks" int the ventricle, but rather is better confined to the grey matter tissue.
Multispectral (3D) Histogram:
If an Alt (alternate) image is available, the 2D histogram for it will also be shown. In addition, a 3D histogram is created. The main Image is on the X-axis, the Alt image is on the Y-axis, and the colored display indicates the number of voxels having a particular pair of values for every possible combination of value pairs between these two images.
The image below shows the HistoMulti menu for the same T1-weighted MRI image shown above, with a coregistered PET-FDG volume as the Alt image. The PET data came from a different subject than the MRI data, which makes for an imperfect registration but lets us illustrate a couple of points.
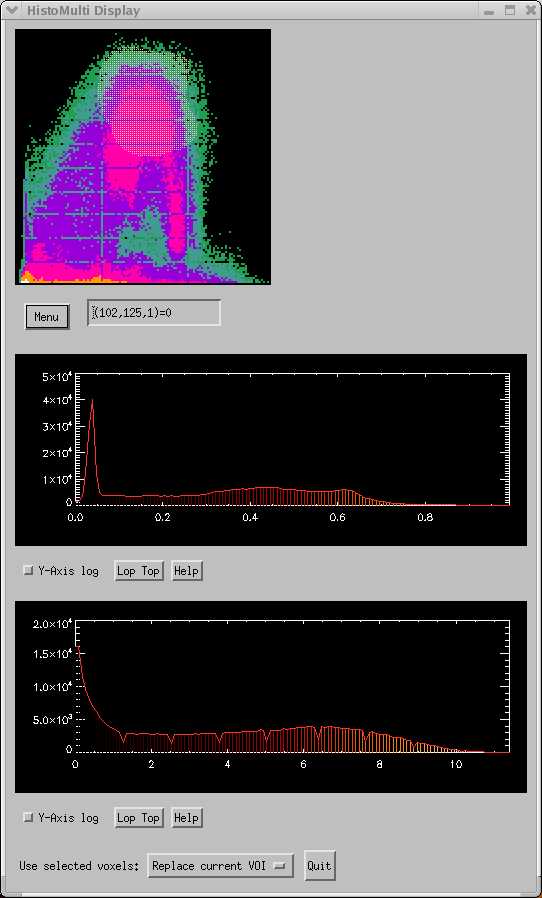
The yellow cloud centered near the top of the 3D histogram shows a region drawn that corresponds to Gray Matter (GM). This region was drawn directly on the display using the mouse to select the desired 3D histogram bins. The corresponding MRI and PET images are shown below.
The first interesting thing to notice is that we can obtain a much more precise definition of a tissue type than if only a single image is used. In the 3D histogram, the values consistent with GM become spread over the various PET values, and certain "islands" or regions that correspond to true GM can be selected. This method works really well with coregistered T1 and T2 images from the same subject in order to segment the brain into gray matter, white matter, and CSF.
 |
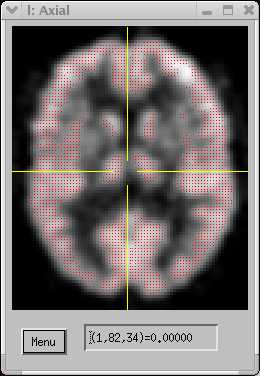 |
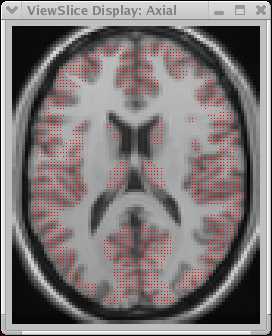
MRI T1 image (far left) and coregtistered PET-FDG image (near left). The PET data is from a different subject than the MRI data. The red region corresponds to the values selected in the 3D histogram. | |||
Notice how the imperfect registration inhibits selection of half of the caudate- only that portion of the caudate confirmed as the correct tissue type by BOTH data sets is included in the VOI.
Brain Segmentation via Multispectral T1/T2 Images
The next example shows how to use a coregistered MRI T1/T2 pair to segment the brain. This is a very powerful and easy to use technique. Combined with the Morphometric operators (Dilate/Erode), whole-brain segmentation can be performed quite accurately in a couple of minutes.
The picture below shows a set of histograms (3D and 2D) for a T1 image (top graph) and a T2 image (bottom graph). The T1 image is plotted along the X-axis of the 3D histogram, and the T2 image is along the Y-axis. Both images were acquired from the same subject and have already been coregistered. The 3D histogram is typical of most T1/T2 multispectral brain combinations.
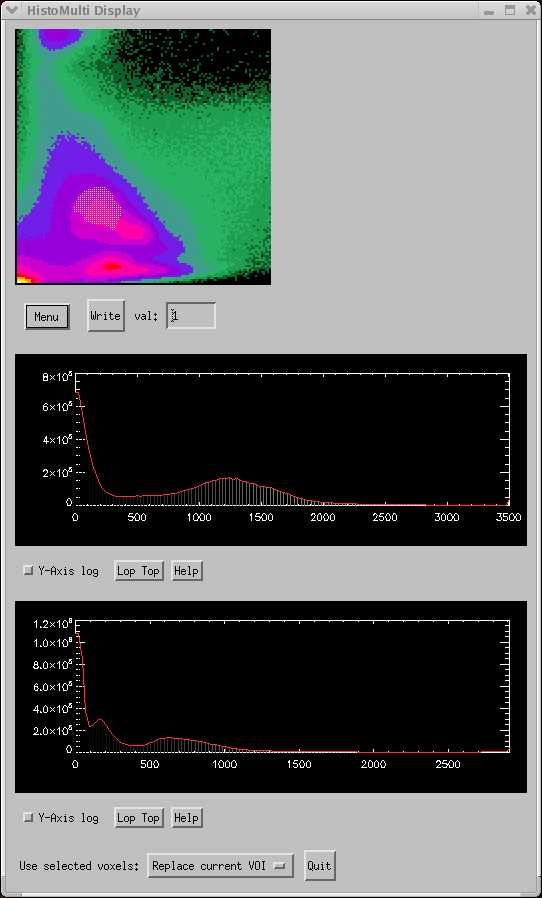
The "islands" in the 3D histogram nicely show the various tissue segments. The yellow "cloud" shows the GM segment, and the corresponding voxels are shown in the coronal image pair below:
 |
 |
||||
| MRI T1-weighted image. The red region shows the gray matter region defined in the 3D histogram. | |||||
| MRI T2-weighted image, coregistered to T1 at left. | |||||
The multispectral GM definition appears quite accurate. Further improvements can be achieved by smoothing the image using a good edge-preserving algorithm.
Whole brain segmentation can be achieved by including the white-matter segment. In the 3D histogram, the WM segment is on the same "island" as the GM segment, but lower and to the right. The CSF segment is the small island at the top, just to the left of center.
Once the 2 or 3 segments of the brain (CSF, GM, WM) have been identified, you can use the 3D search feature of BrainMaker to isolate the brain. Select "Mask" as the search source, and masked regions unconnected to the brain will be eliminated. Usually there will be some "leakage" out of the brain so that regions of the scalp, eyes, etc. may still be connected. To solve this, next perform a 3D Erode, then another 3D search, and finally Dilate the mask back to its original size. This whole set of operations will take about 20 seconds. There is a lot room within this minimal set of instructions for adding your own customized steps to suit your data.
Histogram Tool Components:
The Histogram Tool is written as an IDL Object. The 2D histogram is created using a "HistoTool" object, and one or more of these are incorporated into the "HistoMulti" object to create the overall tool. The Histogram Tool is fairly lightweight, as it utilizes pointers to the image data so data passing and storage are minimized. Each of the object components can be easily incorporated into other programs- ask Terry for hints if you are interested.