Demonstration Pictures for Keck Lab Tours.
This page shows demonstrations of some of the software used in the Keck Lab for image analysis and display. Most of these images were created by simply making a screen-dump, so the images should occupy the entire screen. From your browser, select View -> Full screen.
The following images are in this page:
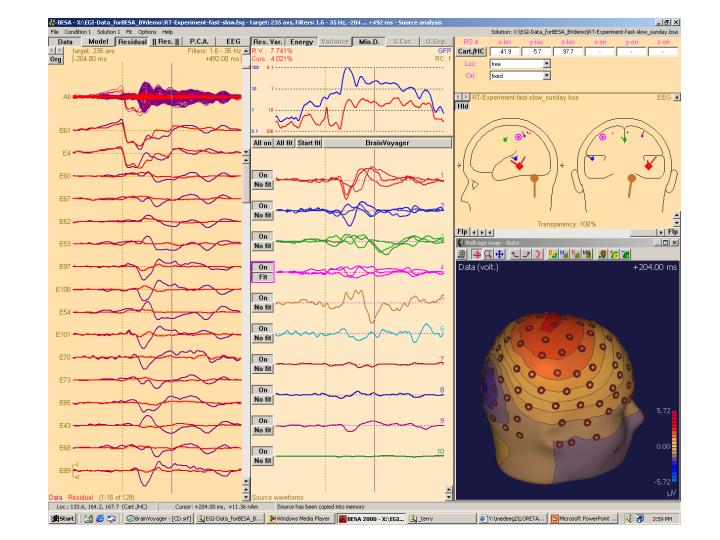
Figure 1. BESA software. Screen dump of a typical analysis and display session. (Images created by Larry Greischar.)
Figure 2.BrainVoyager demo. A 3D rendered head is shown with the position of EEG electrodes designated by red balls. A brain activation region is shown on the brain slice in orange/yellow. (Images created by Larry Greischar.)
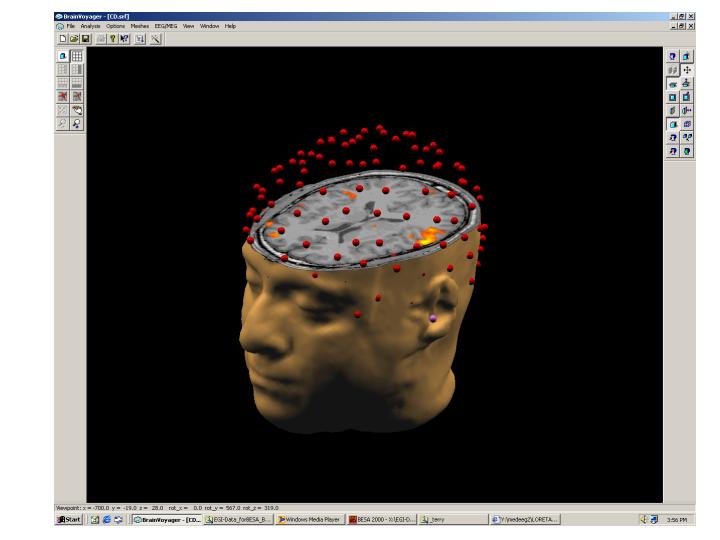
Figure 3. BrainSpinner screendump showing a typical BrainSpinner image, and the program menu used to create it. (Images created by Terry Oakes.)
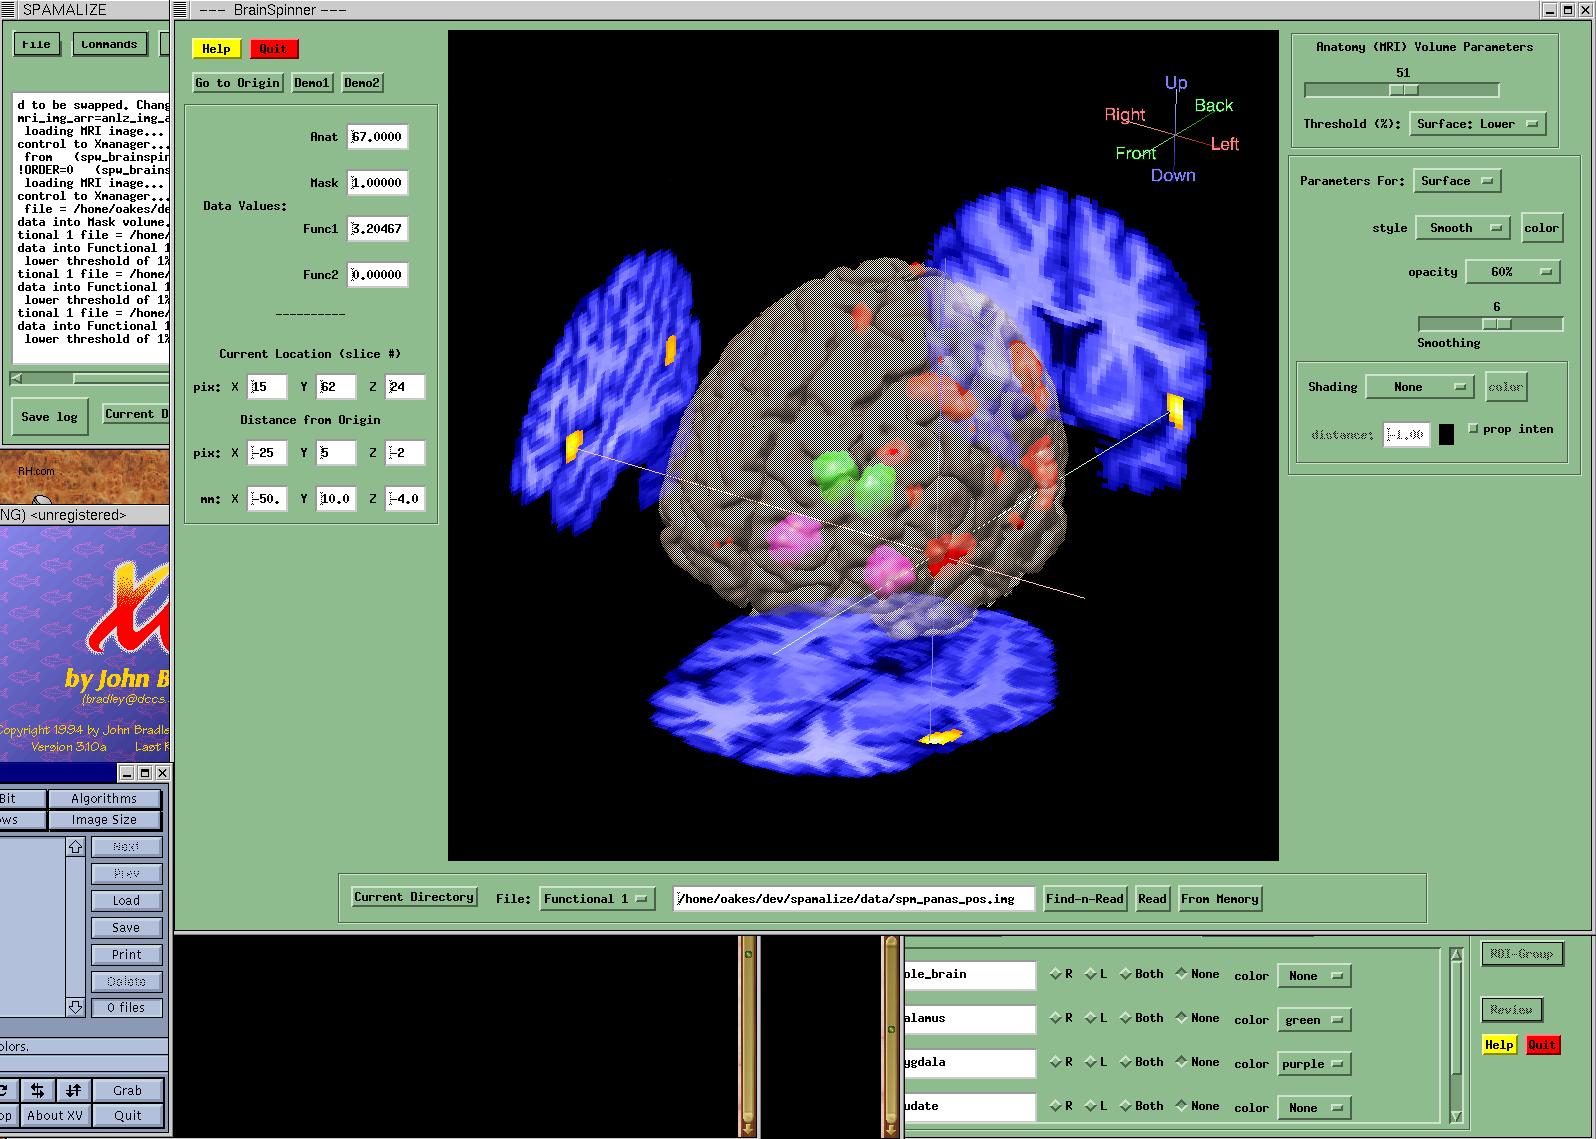
Figure 4. Coregistration Demo. A PET scan (center row) is being coregistered to a MRI scan (top row). The bottom row shows a subtraction image, which can be useful for identifying mismatched regions. The contour lines were generated based on the MRI images, and were then superimposed on the PET images to aid in determining when the images are correctly aligned. (Images created by Terry Oakes.)
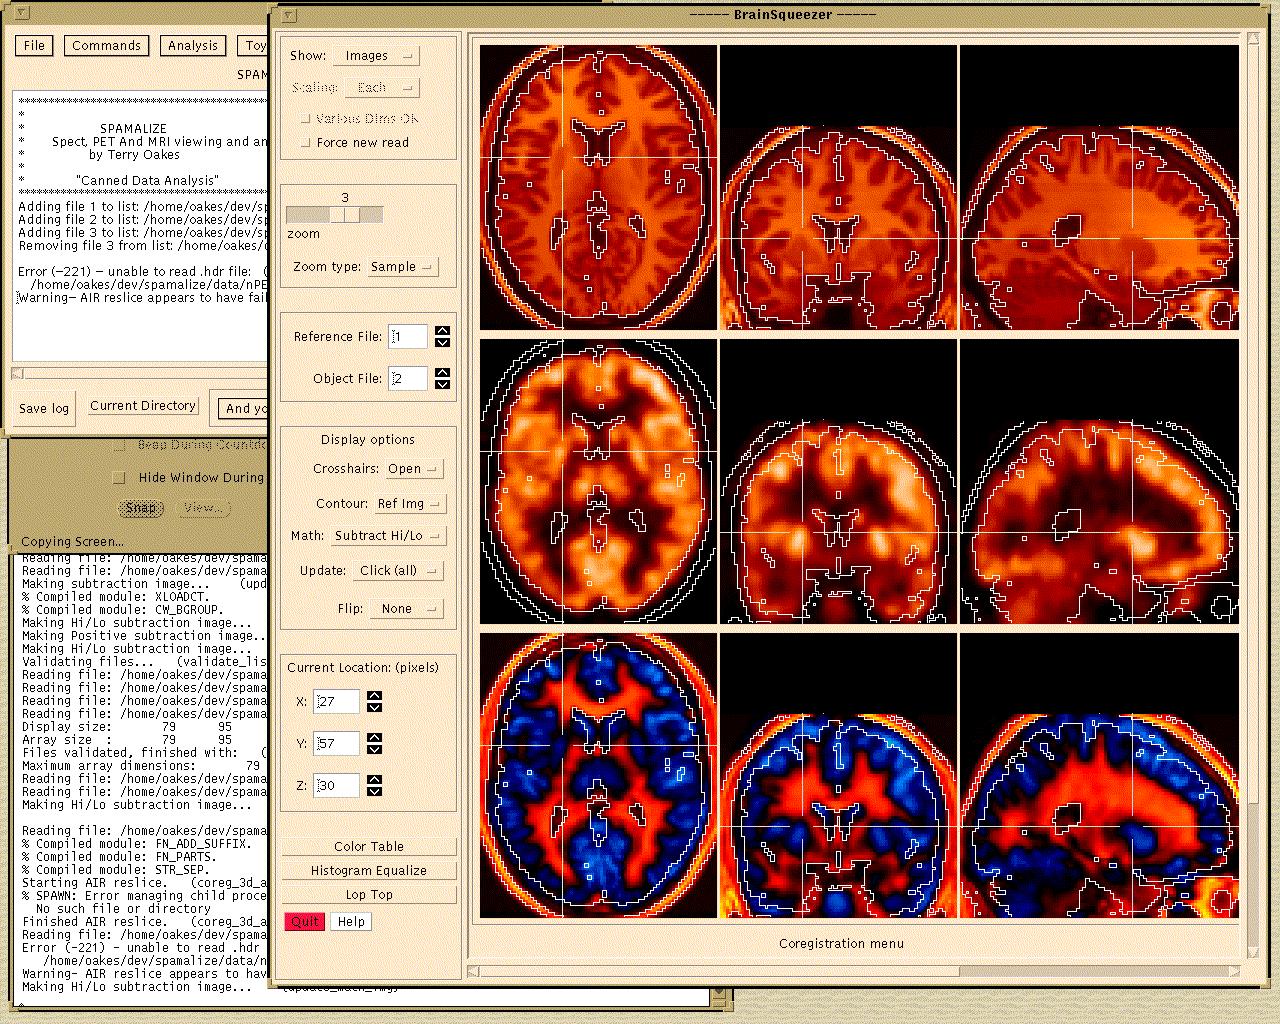
Figure 5. PET PANAS-pos demo. These images show a region of the brain that was found to be correlated with positive emotions. (Images created by Terry Oakes.)
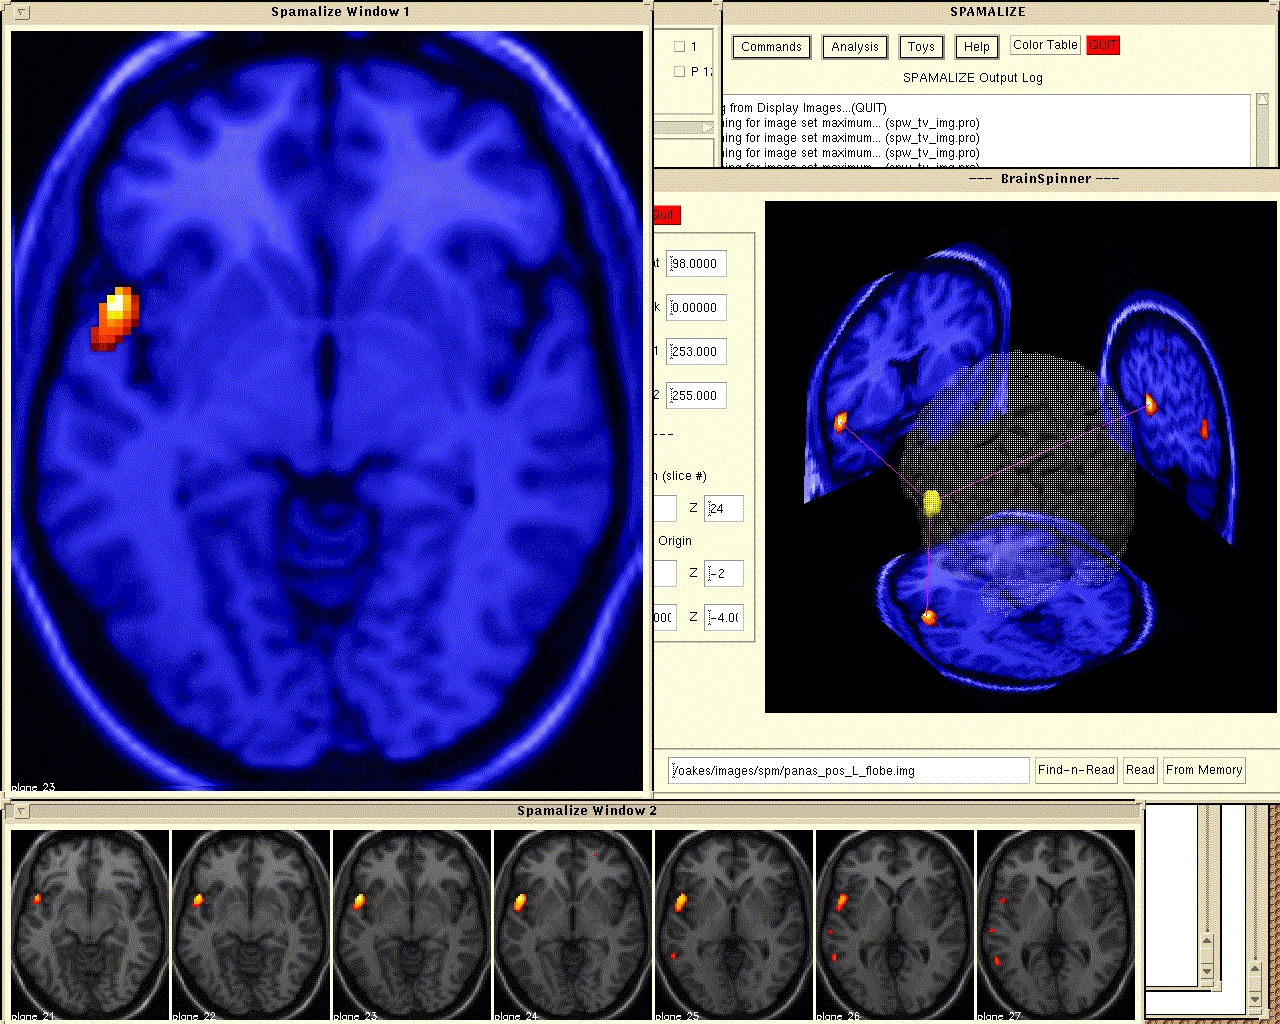
Figure 6. LORETA demos. A three-dimensional tomographic volume of the brain is created, showing estimates of the electrical activity strength that gives rise to observed electrical signals on the scalp. (Images created by Diego Pizzagalli.)
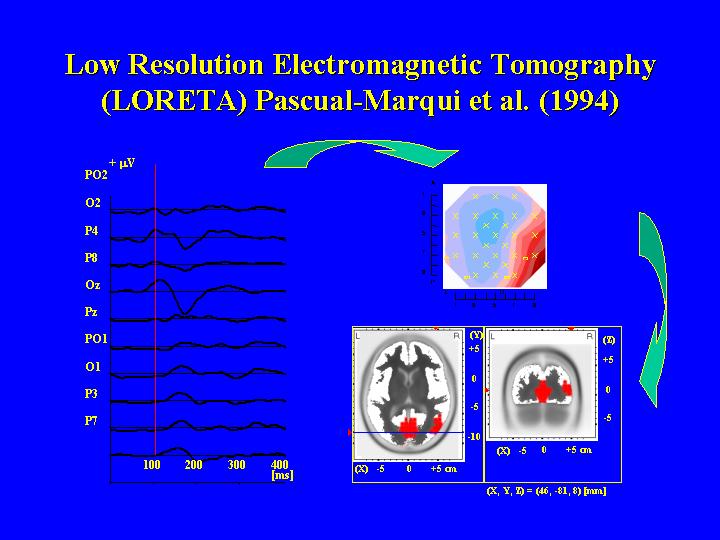
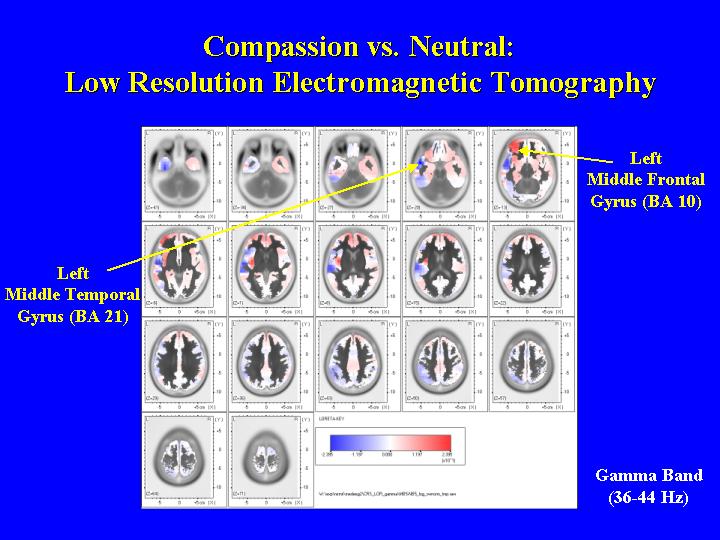
Figure 7. AFNI demonstration. Three orthogonal views of a brain are shown, with activated pixels from a functional measurement shown in orange. (Images created by Hillary Schaefer.)
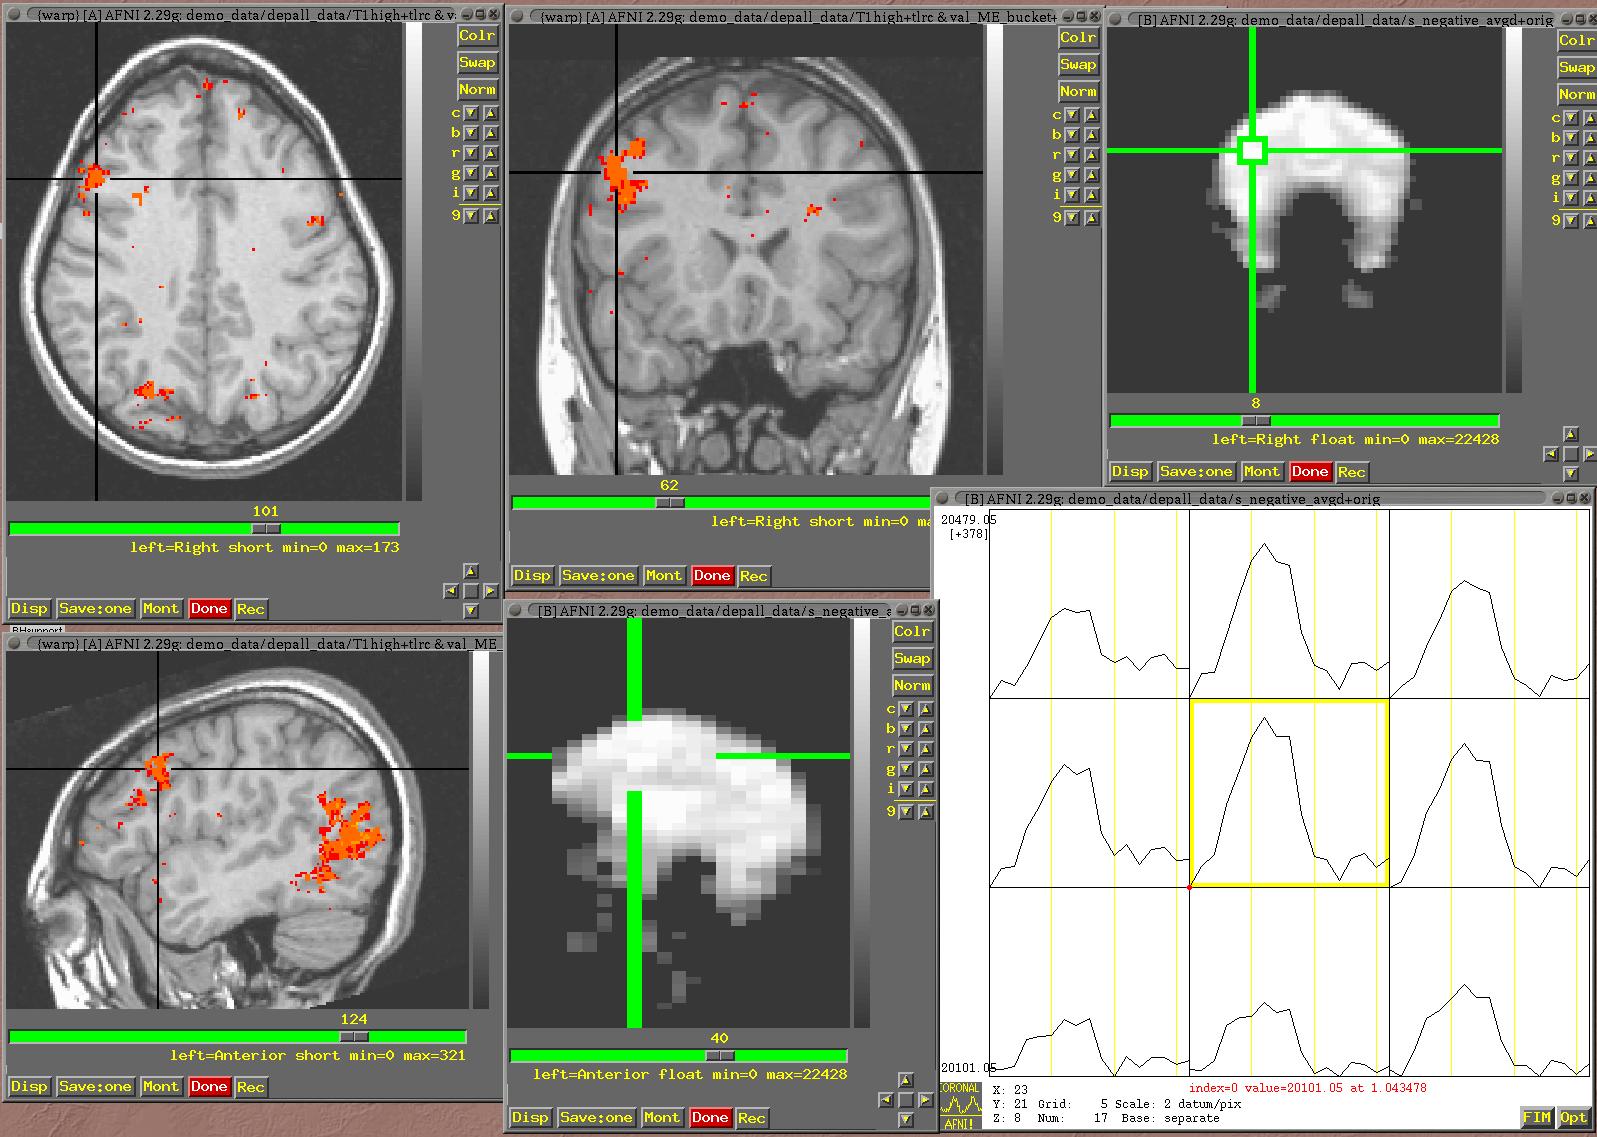
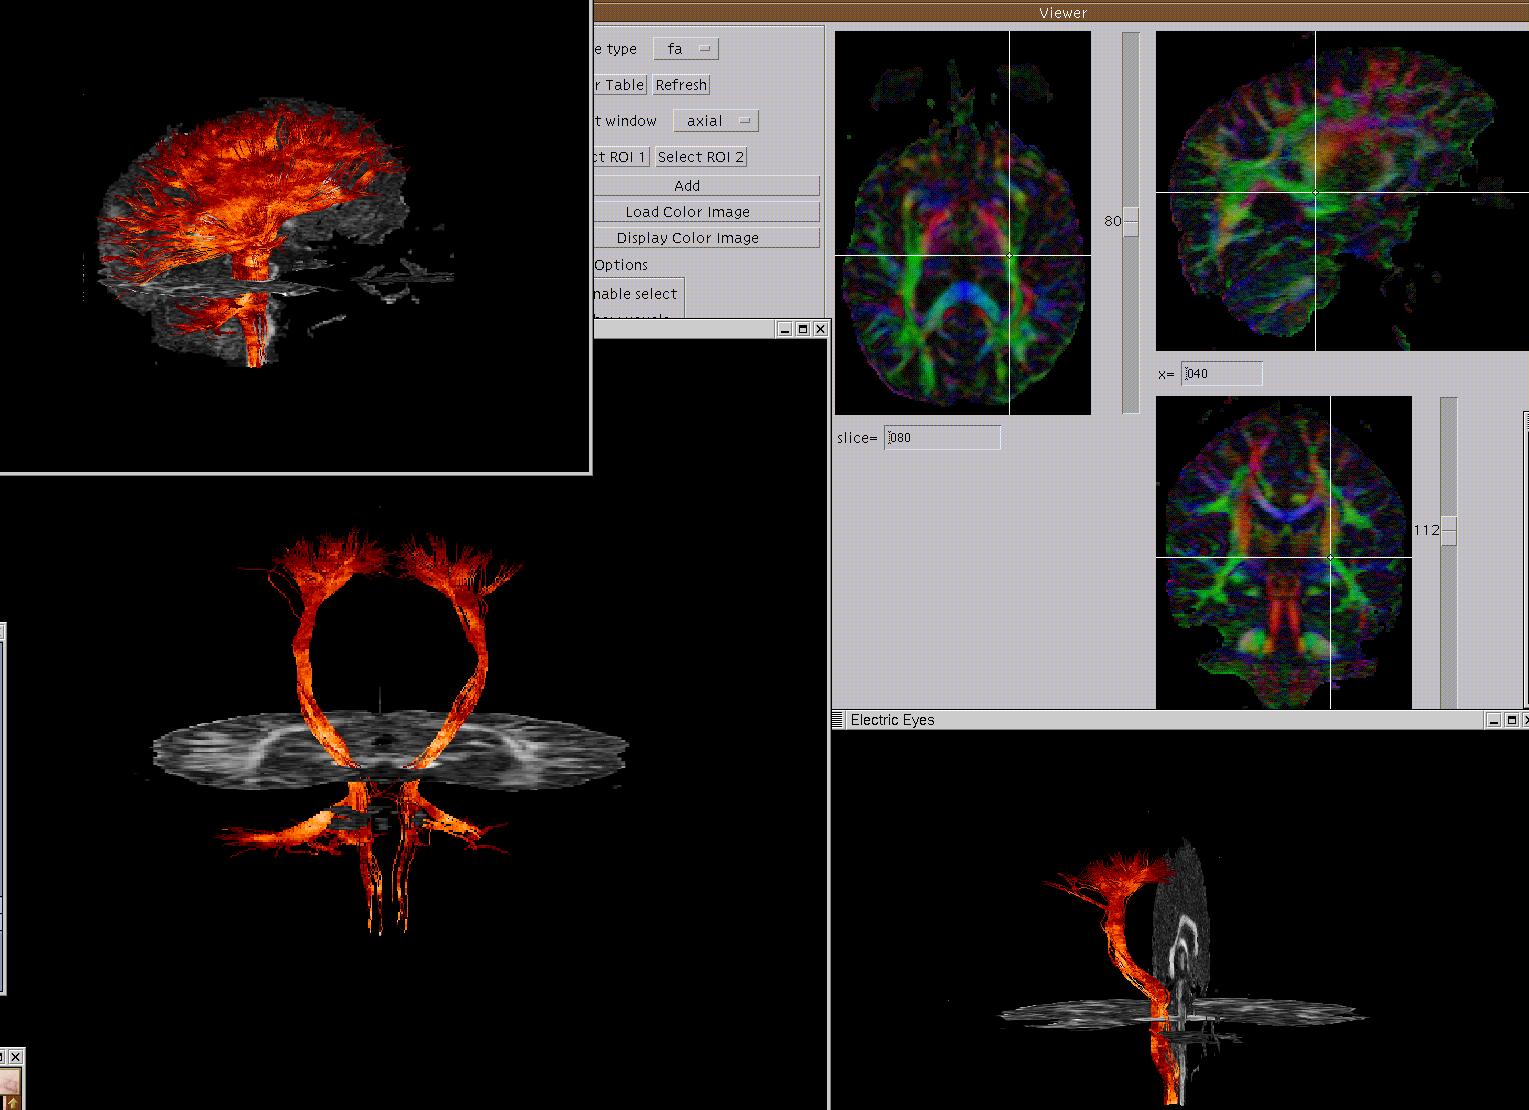
Figure 8. Diffusion Tensor Image (DTI) demo. (Images courtesy of Andy Alexander.)