Autoradiograph Tool

This tool lets you analyze autoradiographic data using the powerful ROI and 3D tools within SPAMALIZE. You can extract multiple adjacent regions from an autoradiograph and then convert these regions to a 3-dimensional array for subsequent analysis and display.

For example, suppose you had an autoradiograph of a series of sequential coronal slices of a rat brain, as in the picture to the right.
Using the Autoradiograph tool, you can rapidly select a sequence of Regions of Interest (ROIs), align each one to the same relative orientation, and create a 3D volume. It took less than one minute to identify the eleven slices of the structure and extract all of the ROI information shown on this page.

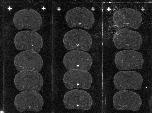
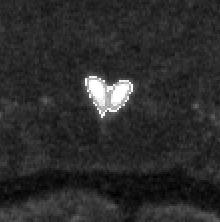
The Autoradiograph creates a magnified image of the area shown inside the red box in the image above. There are a number of handy tools for extracting ROI and background information using an interactive histogram display and threshold levels, such as adjustable magnification (zoom), point-and-click selection of sub-regions from the main image (i.e. the red box), adjustable ROI size and shape, and automatic ROI centering.

The picture to the right shows the magnified area (from inside the red box). The ROI consists of a circle with a radius of 20 pixels, which is large enough to fully encompass the structure of interest and enough background tissue to create a ratio of (activated / BG), which can be used for intra- and inter-subject comparison. The pixels inside the ROI with values greater than the user-specified mask threshold are shown as a semi-transparent mask in brighter shades of white, while background pixels are not included in the mask and thus are not shown in this view (although they could be shown if desired).

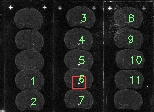
You can examine ROI total values, number of pixels, and average values for the masked and background regions within the ROI. These values can be examined on a slice-by-slice basis or for all slices at once.

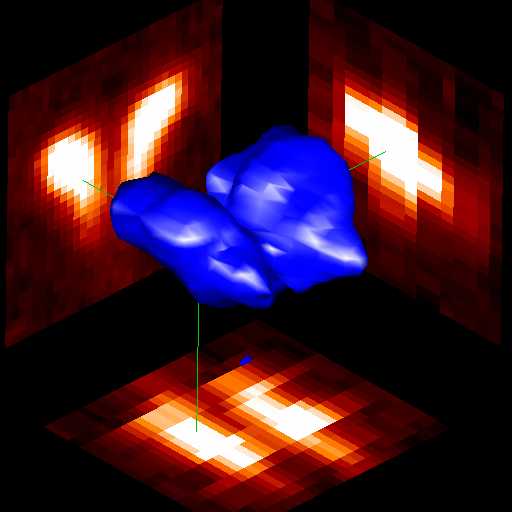
Finally, the sequence of numbered slices can be used to create a 3-dimensional volume. The individual slices are saved to a standard ANALYZE file, and the individual masks (shown in white above) are saved to a seperate ANALYZE-format mask file. Both of these files are compatible with other SPAMALIZE programs, such as BrainMaker (to edit the mask and extract ROI information) and BrainSpinner (used to create the image below).

The image to the right is a 3D view of the structure created from the eleven sequential slices shown above. The blue "cloud" in the center is a 3D rendering of the functional volume denoted in the autoradiographs. The three images show the coronal (upper left), sagittal (upper right), and axial (bottom) slices located at the intersection of the green lines.