 |
Mothers of recently-born babies were shown pictures of their own infants and pictures of other infants while in a MRI scanner. The red "cloud" in the image at left shows a brain region that was activated when mothers saw pictures of their own infants, while the blue "cloud" shows a region that was activated when the mothers saw pictures of other infants. | ||||||
|
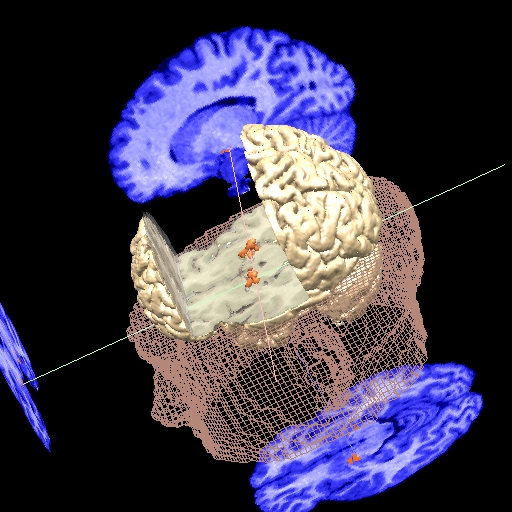
People in a MRI scanner were shown pictures with negative
emotional content (e.g. car accident victims) followed by pictures of
neutral emotional content (e.g. a lamp). The amygdala, shown in orange
in the image at right, shows a significant activation in response to the
emotionally negative pictures.
|
 |
||||||
| The two top images and the image at the bottom were created using functional MRI, which measures blood flow (or more accurately, the level of oxygenation of hemoglobin in the blood). |  |
||||||
 |
|||||||
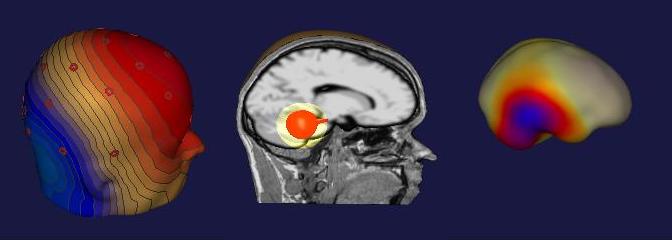
| The images above show the brain's electrical signal strength and location during emotional evaluation of faces. The response of a person looking at 'disliked' faces as measured with EEG sensors distributed over the surface of the scalp is illustrated. The image on the left shows a mapping of the electrical signal measured by 27 sensors on the scalp. A single calculated dipolar source for this signal is shown by the middle image while the right image illustrates a distributed source model located on the surface of the brain. | |||||||
 |
The image at left shows brain locations that were different in a group of depressed patients following an experimental drug treatment for depression. A group of depressed patients were scanned in the MRI scanner at three times: before, during, and after a multi-week drug treatment course. A group of non-depressed people was also scanned at similar time intervals. The red clouds in this movie show brain regions that changed in the depressed group, after taking into account non-treatment-related changes shown by the control group. | ||||||